Rankings
Population density by country — world rankings
Ranking 169 countries with data.
Top 10 · Population density
Population density
| Rank | Country | Value |
|---|---|---|
| 1 | Bangladesh | 1,191/km² (2025) |
| 2 | Palestine | 899/km² (2025) |
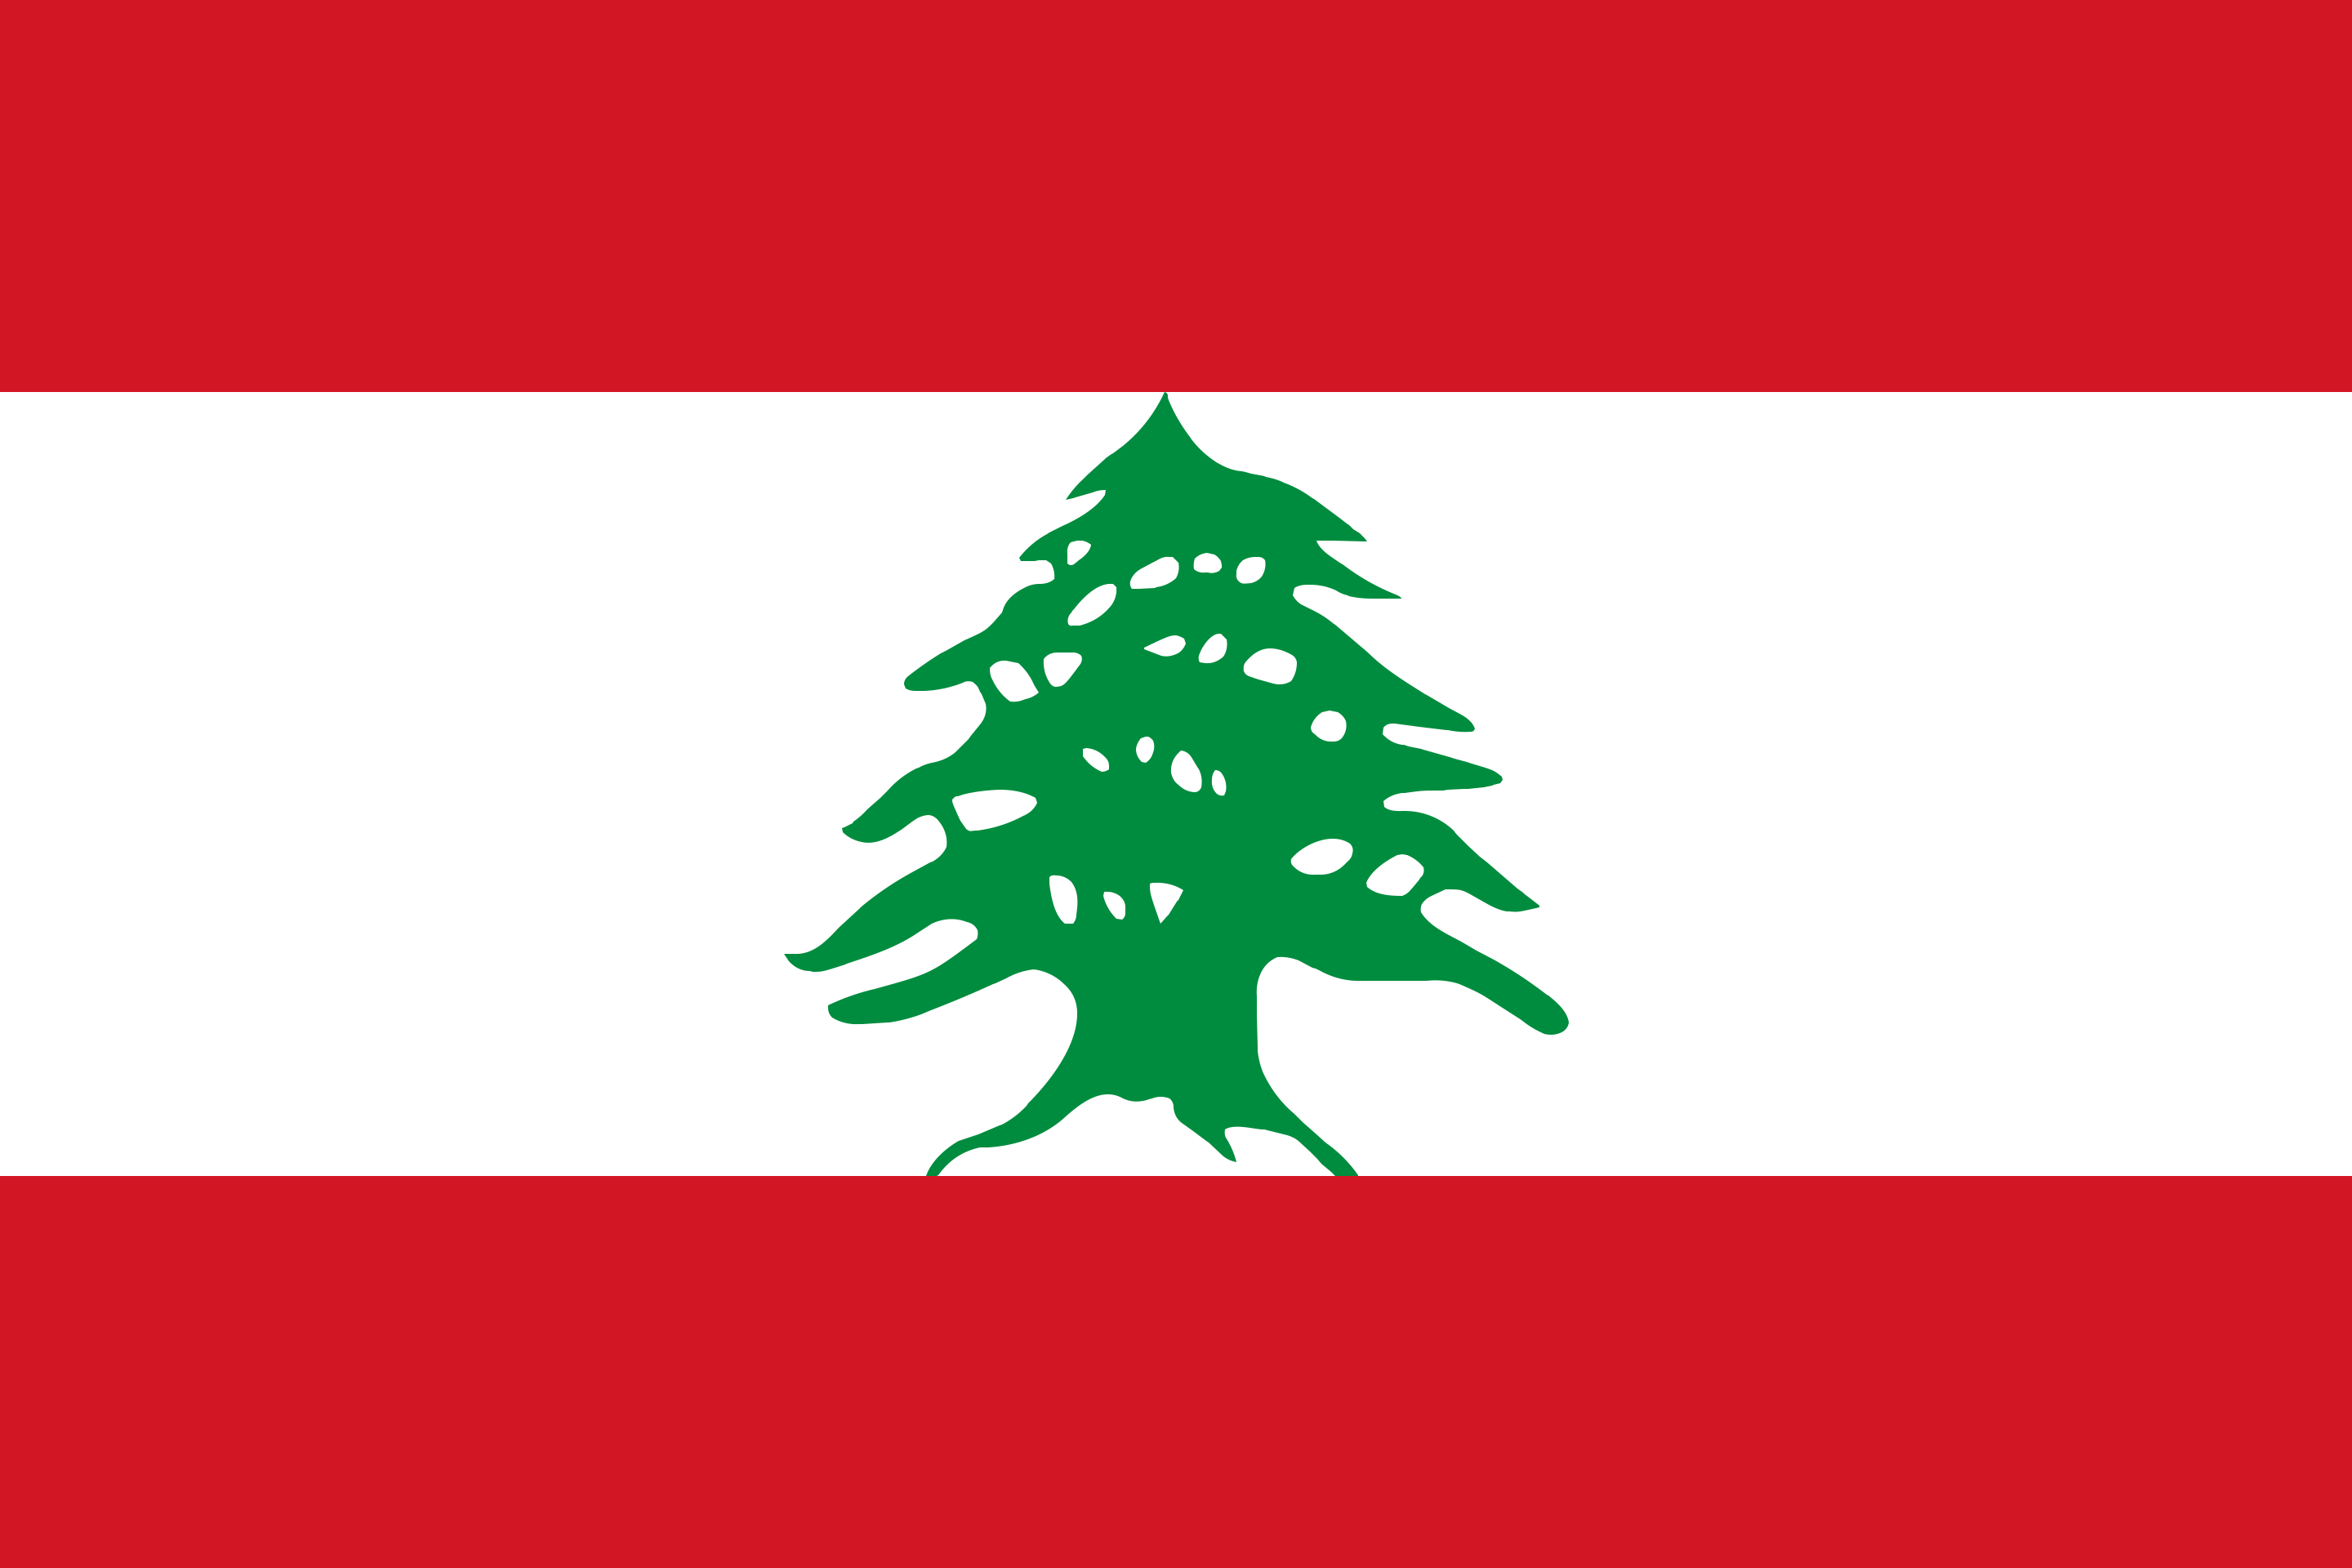
| 3 | Lebanon | 560/km² (2025) |
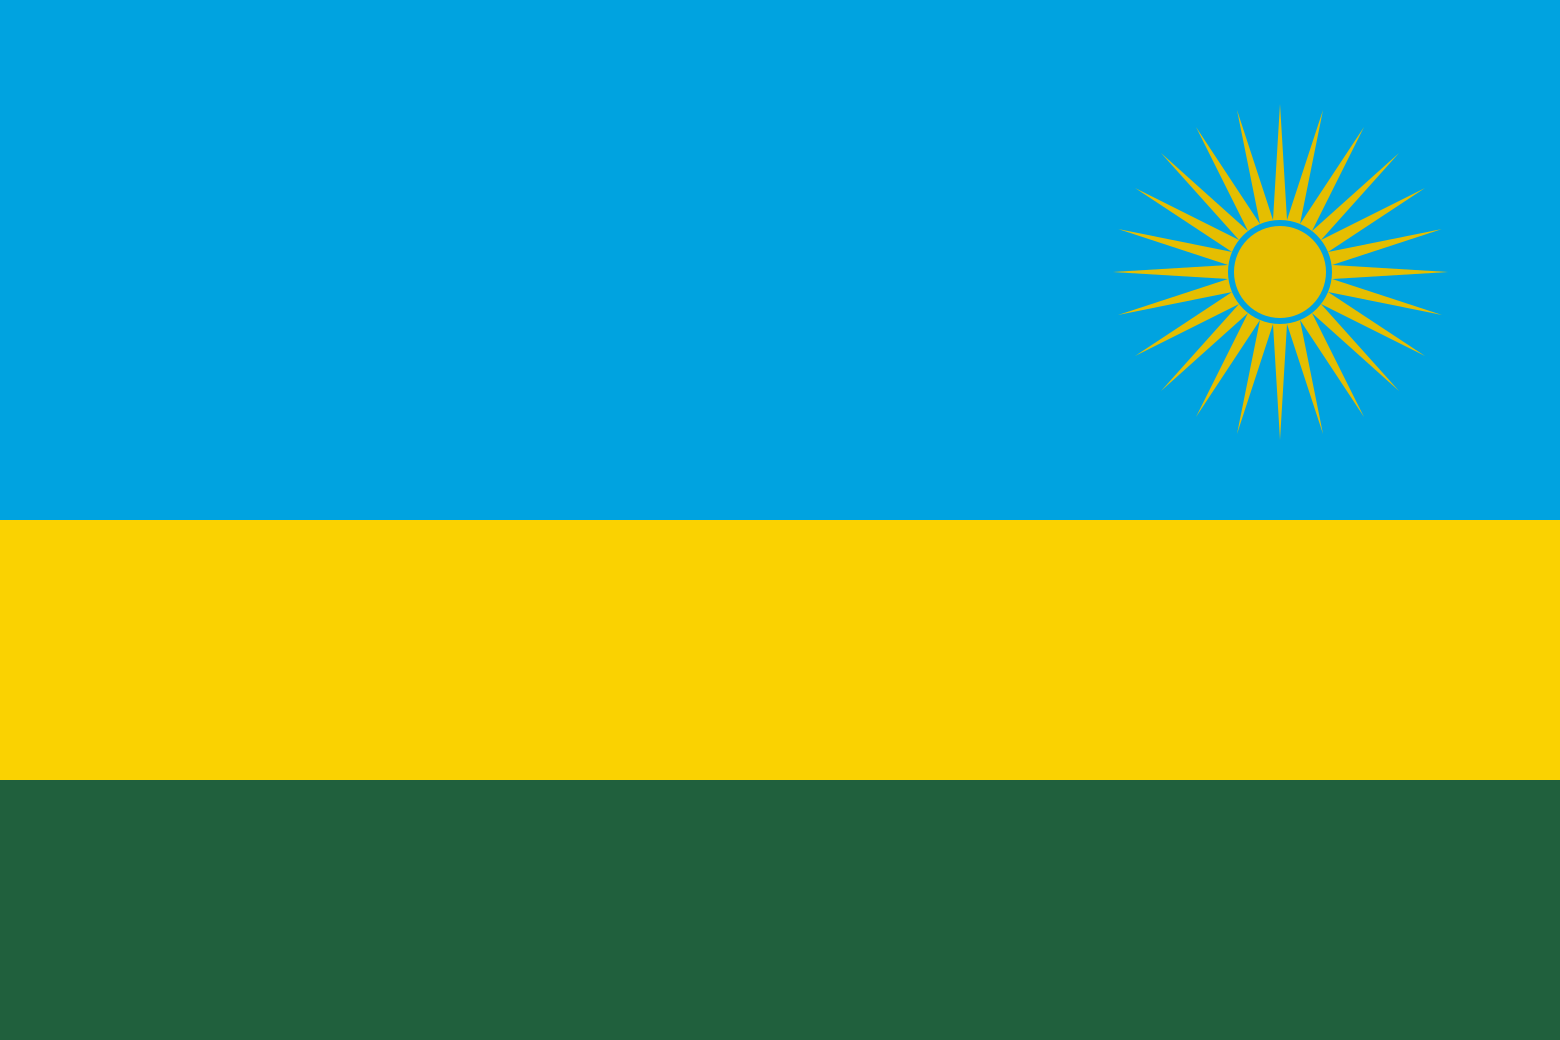
| 4 | Rwanda | 553/km² (2025) |
| 5 | Burundi | 517/km² (2025) |
| 6 | South Korea | 515/km² (2025) |
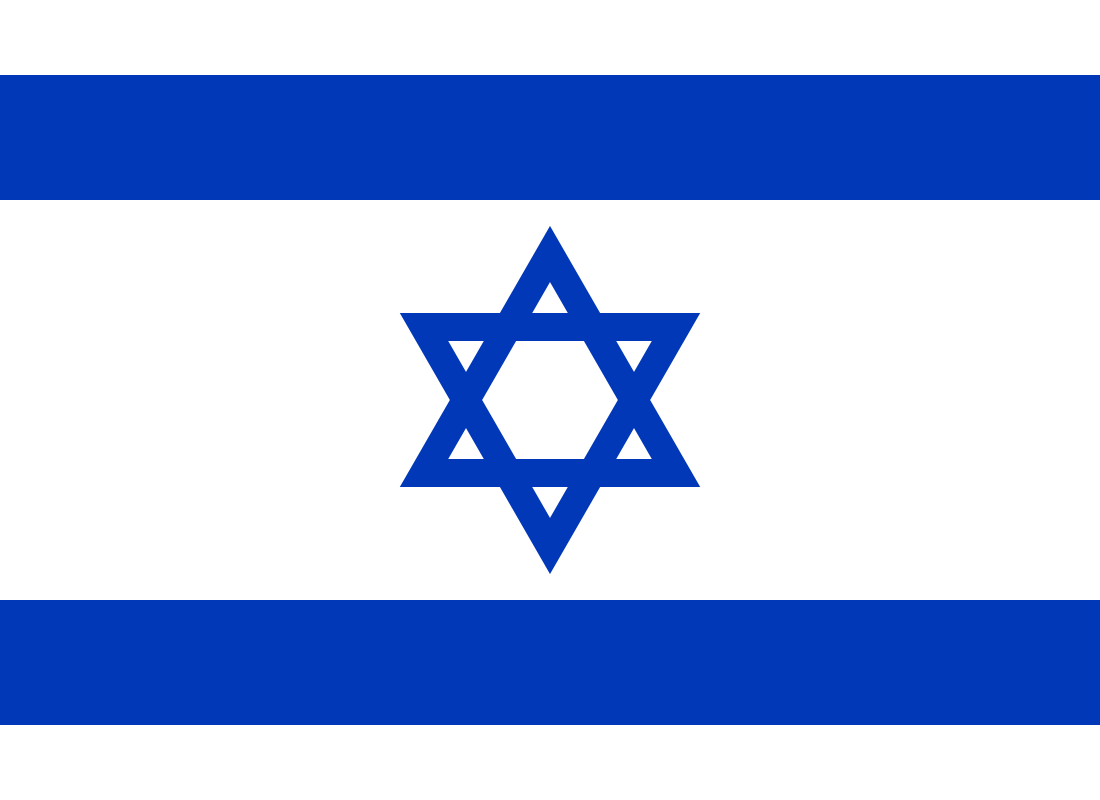
| 7 | Israel | 459/km² (2025) |
| 8 | India | 445/km² (2025) |
| 9 | Netherlands | 435/km² (2025) |
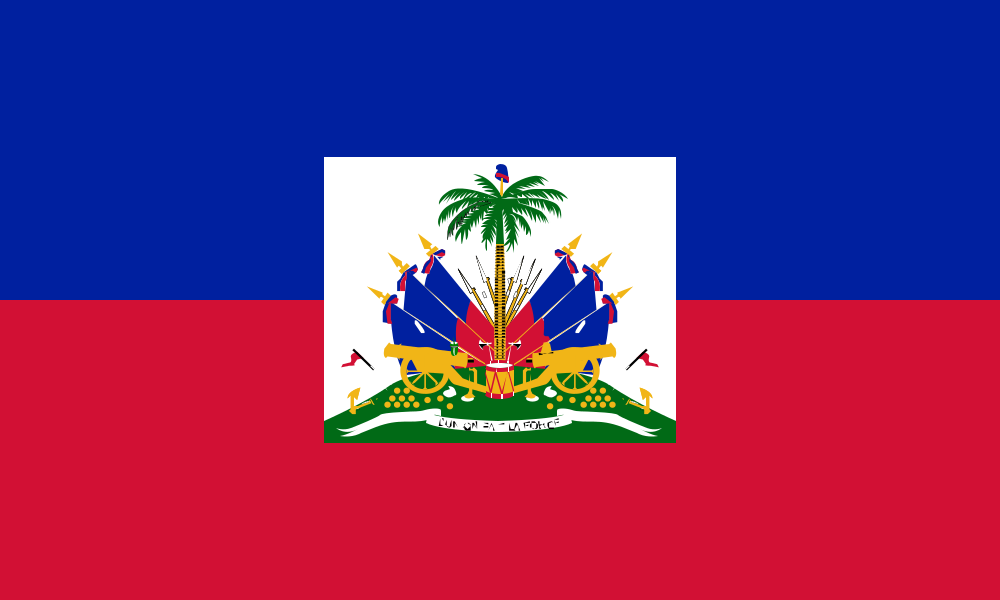
| 10 | Haiti | 429/km² (2025) |
| 11 | Philippines | 389/km² (2025) |
| 12 | Belgium | 389/km² (2025) |
| 13 | Puerto Rico | 359/km² (2025) |
| 14 | Sri Lanka | 332/km² (2025) |
| 15 | Japan | 326/km² (2025) |
| 16 | Pakistan | 321/km² (2025) |
| 17 | Vietnam | 307/km² (2025) |
| 18 | El Salvador | 303/km² (2025) |
| 19 | United Kingdom | 285/km² (2025) |
| 20 | Kuwait | 273/km² (2025) |
| 21 | Trinidad and Tobago | 267/km² (2025) |
| 22 | Luxembourg | 265/km² (2025) |
| 23 | Qatar | 259/km² (2025) |
| 24 | Jamaica | 258/km² (2025) |
| 25 | Nigeria | 257/km² (2025) |
| 26 | Gambia | 250/km² (2025) |
| 27 | Germany | 233/km² (2025) |
| 28 | North Korea | 220/km² (2025) |
| 29 | Switzerland | 220/km² (2025) |
| 30 | Uganda | 213/km² (2025) |
| 31 | Nepal | 201/km² (2025) |
| 32 | Italy | 195/km² (2025) |
| 33 | Malawi | 188/km² (2025) |
| 34 | Guatemala | 172/km² (2025) |
| 35 | Togo | 151/km² (2025) |
| 36 | Indonesia | 149/km² (2025) |
| 37 | Cyprus | 148/km² (2025) |
| 38 | China | 147/km² (2025) |
| 39 | Ghana | 147/km² (2025) |
| 40 | Denmark | 140/km² (2025) |
| 41 | Thailand | 140/km² (2025) |
| 42 | Syria | 138/km² (2025) |
| 43 | Czechia | 138/km² (2025) |
| 44 | Benin | 129/km² (2025) |
| 45 | Jordan | 129/km² (2025) |
| 46 | Sierra Leone | 122/km² (2025) |
| 47 | Ethiopia | 119/km² (2025) |
| 48 | Azerbaijan | 118/km² (2025) |
| 49 | Egypt | 118/km² (2025) |
| 50 | Portugal | 117/km² (2025) |
| 51 | United Arab Emirates | 117/km² (2025) |
| 52 | Poland | 116/km² (2025) |
| 53 | France | 113/km² (2025) |
| 54 | Slovakia | 110/km² (2025) |
| 55 | Austria | 110/km² (2025) |
| 56 | Turkey | 109/km² (2025) |
| 57 | Malaysia | 109/km² (2025) |
| 58 | Iraq | 108/km² (2025) |
| 59 | Slovenia | 104/km² (2025) |
| 60 | Armenia | 104/km² (2025) |
| 61 | Hungary | 102/km² (2025) |
| 62 | Côte d'Ivoire | 101/km² (2025) |
| 63 | Costa Rica | 101/km² (2025) |
| 64 | Cuba | 99.5/km² (2025) |
| 65 | Cambodia | 98.6/km² (2025) |
| 66 | Honduras | 97.8/km² (2025) |
| 67 | Spain | 97.5/km² (2025) |
| 68 | Kenya | 97.2/km² (2025) |
| 69 | Senegal | 96.2/km² (2025) |
| 70 | Timor-Leste | 95.4/km² (2025) |
| 71 | Burkina Faso | 87.8/km² (2025) |
| 72 | Morocco | 86.1/km² (2025) |
| 73 | Uzbekistan | 82.5/km² (2025) |
| 74 | Albania | 81.7/km² (2025) |
| 75 | Myanmar | 81.1/km² (2025) |
| 76 | Brunei | 80.8/km² (2025) |
| 77 | Romania | 79.8/km² (2025) |
| 78 | Yemen | 79.1/km² (2025) |
| 79 | Greece | 78.9/km² (2025) |
| 80 | Dominican Rep. | 78.5/km² (2025) |
| 81 | Ireland | 78.0/km² (2025) |
| 82 | Lesotho | 77.8/km² (2025) |
| 83 | Serbia | 77.1/km² (2025) |
| 84 | Tajikistan | 76.3/km² (2025) |
| 85 | Tunisia | 75.5/km² (2025) |
| 86 | Tanzania | 74.5/km² (2025) |
| 87 | eSwatini | 72.4/km² (2025) |
| 88 | Ecuador | 71.3/km² (2025) |
| 89 | Macedonia | 70.8/km² (2025) |
| 90 | Moldova | 69.7/km² (2025) |
| 91 | Eq. Guinea | 69.1/km² (2025) |
| 92 | Mexico | 67.4/km² (2025) |
| 93 | Afghanistan | 67.2/km² (2025) |
| 94 | Ukraine | 64.6/km² (2025) |
| 95 | Cameroon | 62.8/km² (2025) |
| 96 | Guinea-Bissau | 62.3/km² (2025) |
| 97 | Guinea | 61.4/km² (2025) |
| 98 | Bosnia and Herz. | 61.3/km² (2025) |
| 99 | Panama | 60.7/km² (2025) |
| 100 | Bulgaria | 58.0/km² (2025) |
| 101 | Georgia | 56.5/km² (2025) |
| 102 | Madagascar | 55.7/km² (2025) |
| 103 | Nicaragua | 53.8/km² (2025) |
| 104 | South Africa | 53.1/km² (2025) |
| 105 | Iran | 53.0/km² (2025) |
| 106 | Liberia | 51.5/km² (2025) |
| 107 | Fiji | 51.1/km² (2025) |
| 108 | Djibouti | 51.0/km² (2025) |
| 109 | Dem. Rep. Congo | 48.1/km² (2025) |
| 110 | Colombia | 46.8/km² (2025) |
| 111 | Montenegro | 44.9/km² (2025) |
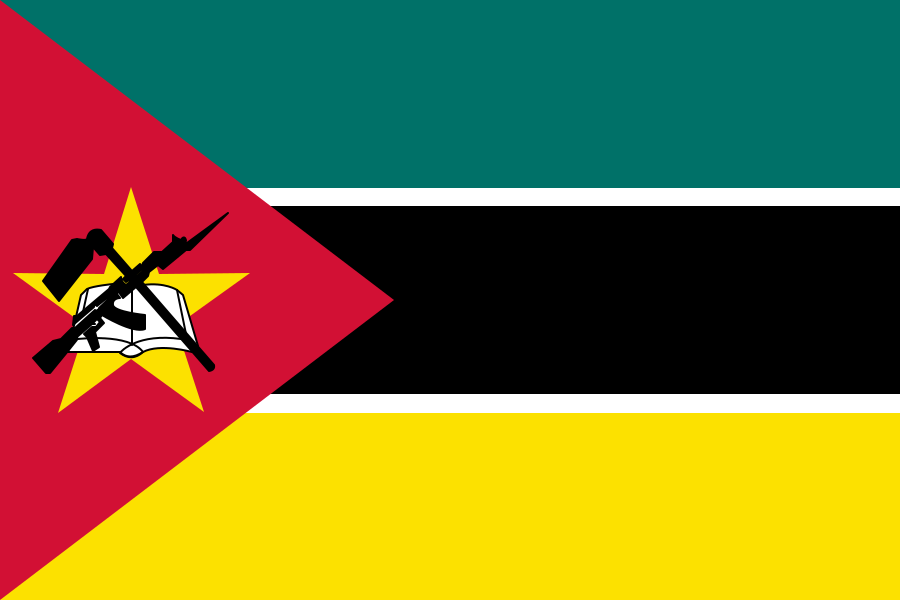
| 112 | Mozambique | 44.6/km² (2025) |
| 113 | Lithuania | 44.2/km² (2025) |
| 114 | Croatia | 44.0/km² (2025) |
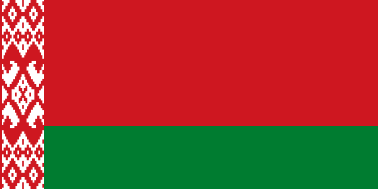
| 115 | Belarus | 43.8/km² (2025) |
| 116 | Zimbabwe | 43.4/km² (2025) |
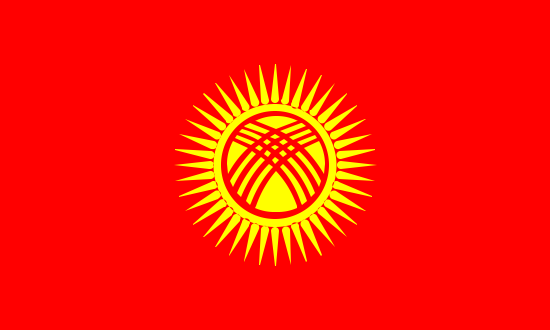
| 117 | Kyrgyzstan | 36.7/km² (2025) |
| 118 | United States | 34.8/km² (2025) |
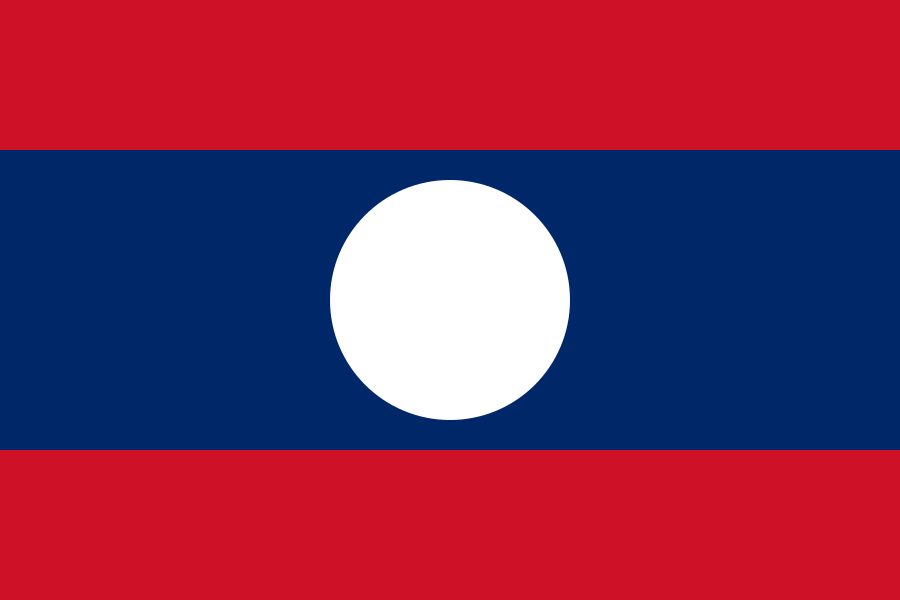
| 119 | Laos | 33.2/km² (2025) |
| 120 | Angola | 31.3/km² (2025) |
| 121 | Venezuela | 31.3/km² (2025) |
| 122 | Somalia | 30.8/km² (2025) |
| 123 | Estonia | 30.1/km² (2025) |
| 124 | Eritrea | 29.6/km² (2025) |
| 125 | Zambia | 29.1/km² (2025) |
| 126 | Bahamas | 29.0/km² (2025) |
| 127 | Solomon Is. | 29.0/km² (2025) |
| 128 | Latvia | 28.6/km² (2025) |
| 129 | Sudan | 27.5/km² (2025) |
| 130 | Vanuatu | 27.5/km² (2025) |
| 131 | Peru | 26.9/km² (2025) |
| 132 | Chile | 26.2/km² (2025) |
| 133 | Brazil | 25.0/km² (2025) |
| 134 | Papua New Guinea | 23.3/km² (2025) |
| 135 | Niger | 22.0/km² (2025) |
| 136 | Bhutan | 20.8/km² (2025) |
| 137 | Mali | 20.3/km² (2025) |
| 138 | Sweden | 20.0/km² (2025) |
| 139 | Algeria | 19.9/km² (2025) |
| 140 | New Zealand | 19.9/km² (2025) |
| 141 | Uruguay | 19.2/km² (2025) |
| 142 | Congo | 19.0/km² (2025) |
| 143 | S. Sudan | 18.8/km² (2025) |
| 144 | Belize | 18.4/km² (2025) |
| 145 | Oman | 17.8/km² (2025) |
| 146 | Paraguay | 17.2/km² (2025) |
| 147 | Saudi Arabia | 17.2/km² (2025) |
| 148 | Finland | 16.7/km² (2025) |
| 149 | Argentina | 16.5/km² (2025) |
| 150 | Chad | 16.4/km² (2025) |
| 151 | New Caledonia | 15.9/km² (2025) |
| 152 | Turkmenistan | 15.5/km² (2025) |
| 153 | Bolivia | 11.5/km² (2025) |
| 154 | Gabon | 9.7/km² (2025) |
| 155 | Norway | 9.0/km² (2025) |
| 156 | Central African Rep. | 8.8/km² (2025) |
| 157 | Russia | 8.4/km² (2025) |
| 158 | Kazakhstan | 7.6/km² (2025) |
| 159 | Mauritania | 5.2/km² (2025) |
| 160 | Botswana | 4.4/km² (2025) |
| 161 | Libya | 4.2/km² (2025) |
| 162 | Suriname | 3.9/km² (2025) |
| 163 | Guyana | 3.9/km² (2025) |
| 164 | Iceland | 3.8/km² (2025) |
| 165 | Namibia | 3.8/km² (2025) |
| 166 | Australia | 3.6/km² (2025) |
| 167 | Canada | 2.7/km² (2025) |
| 168 | Mongolia | 2.3/km² (2025) |
| 169 | Greenland | 0.1/km² (2025) |
























































































Ordered by value, highest first (ties break by country slug). Countries without data for this metric are not listed — they occupy no rank.
Surface area is computed from Natural Earth 1:110m boundaries with an equal-area spherical formula — not the World Bank's land-area figure; population density is our own derived metric (latest population ÷ that area).
The unweighted median across the 169 countries with data is 75.5/km² — shown for context, not a world average.
More rankings
- Population
- Population growth
- Urban population share
- Population aged 65+
- Fertility rate
- Birth rate
- Death rate
- Net migration
- GDP (total)
- GDP per capita
- GNI per capita
- GDP growth (annual)
- Inflation rate
- Unemployment rate
- Gini index
- Poverty rate ($2.15/day)
- Exports share of GDP
- Imports share of GDP
- Agriculture share of GDP
- Manufacturing share of GDP
- International tourist arrivals
- Tourism receipts
- Life expectancy
- Infant mortality
Show 21 more Show less
- Under-five mortality
- DPT immunization
- Hospital beds
- Health spending share of GDP
- Secondary school enrollment
- Education spending share of GDP
- Human Development Index
- Internet users
- Mobile subscriptions
- Fixed broadband
- Electricity access
- CO₂ emissions per capita
- CO₂ emissions (total)
- Renewable electricity share
- Renewable energy consumption
- Forest area
- Agricultural land
- Arable land
- PM2.5 exposure
- Military spending
- Surface area
Related tools and comparisons
Compare any two countries metric by metric →
See countries at their true size on a drag-and-drop map →
Data & method
Indicators: World Bank Open Data, 43 indicators — CC BY 4.0 © World Bank — https://creativecommons.org/licenses/by/4.0/; Surface area (sq. km) — CC BY 4.0 © World Bank — https://creativecommons.org/licenses/by/4.0/; Human Development Index — CC BY 3.0 IGO © United Nations Development Programme — https://hdr.undp.org/terms-use
Boundaries: Natural Earth 1:110m (public domain); surface areas are computed with an equal-area spherical formula (Chamberlin–Duquette).
Reference facts (capital, languages, currencies, subregion): mledoze/countries (ODbL).