Country profile
Costa Rica
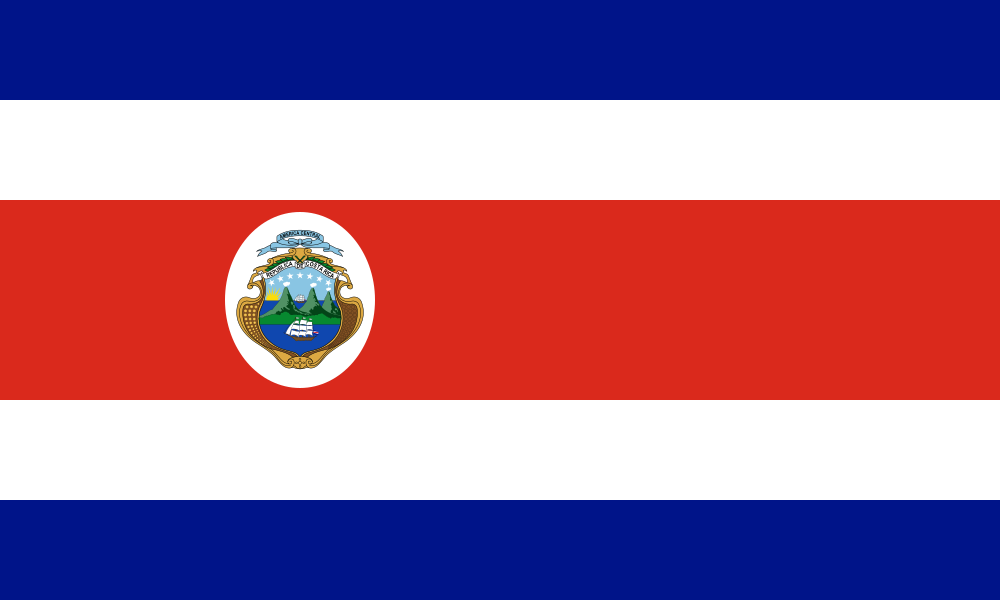
- Continent: North America
- Surface area: 51,100 km²
- Population density: 101/km²
At a glance
- Costa Rica has a population of about 5.2M; its total GDP of $102.9B ranks #73 of 168 countries with data.
- Its surface area of 51,100 km² is about 26% of the world median of 198,330 km².
- Surface area stands out most against the median: 51,100 km² — rank #131 of 176 countries with data.
Where Costa Rica stands
Population log axis
GDP (total) log axis
GDP per capita log axis
Life expectancy
Every dot is one country with data — the highlighted dot is this country; the dashed line marks the world median. Wide-range metrics use a logarithmic axis (tagged) so the whole field stays readable.
Costa Rica: all 46 metrics vs the world median
| Metric | Value | Trend | Rank | vs median |
|---|---|---|---|---|
| Population & land | ||||
| Population | 5.2M (2025) | +26% | #124 / 169 | median 11.5M · 45% |
| Population growth | 0.4% (2025) | −73% | #121 / 169 | median 1.1% · 41% |
| Urban population share | 79.7% (2025) | +30% | #39 / 169 | median 63.8% · 1.2× |
| Population aged 65+ | 12.8% (2025) | +118% | #55 / 169 | median 7.4% · 1.7× |
| Fertility rate | 1.3 (2024) | −39% | #148 / 169 | median 2.1 · 63% |
| Birth rate | 10.0‰ (2024) | −45% | #125 / 169 | median 16.0‰ · 63% |
| Death rate | 5.6‰ (2024) | +44% | #136 / 169 | median 7.1‰ · 78% |
| Net migration | 1K (2025) | −83% | #59 / 169 | N/A |
| Surface area | 51,100 km² (2023) | #131 / 176 | median 198,330 km² · 26% | |
| Population density derived | 101/km² (2025) | +26% | #63 / 169 | median 75.5/km² · 1.3× |
| Economy | ||||
| GDP (total) | $102.9B (2025) | +521% | #73 / 168 | median $80.7B · 1.3× |
| GDP per capita | $19,970 (2025) | +391% | #49 / 168 | median $6,834 · 2.9× |
| GNI per capita | $17,930 (2025) | +373% | #51 / 168 | median $6,350 · 2.8× |
| GDP growth (annual) | 4.6% (2025) | +33% | #48 / 168 | median 3.1% · 1.5× |
| Inflation rate | -0.1% (2025) | −101% | #152 / 162 | N/A |
| Unemployment rate | 6.8% (2025) | +7% | #58 / 168 | median 5.1% · 1.3× |
| Gini index | 45.5 (2025) | −12% | #16 / 153 | median 35.3 · 1.3× |
| Poverty rate ($2.15/day) | 0.8% (2025) | −88% | #101 / 153 | median 2.5% · 32% |
| Trade & industry | ||||
| Exports share of GDP | 38.8% (2025) | −1% | #73 / 163 | median 35.0% · 1.1× |
| Imports share of GDP | 32.6% (2025) | −21% | #103 / 163 | median 40.2% · 81% |
| Agriculture share of GDP | 3.4% (2025) | −60% | #114 / 168 | median 7.2% · 47% |
| Manufacturing share of GDP | 13.6% (2025) | −21% | #53 / 165 | median 11.2% · 1.2× |
| International tourist arrivals | 1.1M (2020) | −14% | #80 / 162 | median 1.1M · 1.0× |
| Tourism receipts | $1.5B (2020) | +3% | #62 / 165 | median $705M · 2.1× |
| Health & education | ||||
| Life expectancy | 81.0 years (2024) | +4% | #31 / 169 | median 73.8 years · 1.1× |
| Infant mortality | 9.1‰ (2024) | −13% | #101 / 166 | median 13.1‰ · 70% |
| Under-five mortality | 10.4‰ (2024) | −15% | #101 / 166 | median 15.8‰ · 66% |
| DPT immunization | 99.0% (2024) | +5% | #2 / 166 | median 90.5% · 1.1× |
| Hospital beds | 1.1 per 1,000 (2022) | −26% | #117 / 167 | median 2.0 per 1,000 · 56% |
| Health spending share of GDP | 6.9% (2023) | −0% | #77 / 165 | median 6.5% · 1.1× |
| Secondary school enrollment | 121.8% (2024) | +86% | #10 / 167 | median 90.5% · 1.3× |
| Education spending share of GDP | 5.3% (2023) | +3% | #38 / 165 | median 4.1% · 1.3× |
| Society & living | ||||
| Human Development Index | 0.833 (2023) | +14% | #52 / 165 | median 0.754 · 1.1× |
| Internet users | 87.2% (2024) | +338% | #64 / 169 | median 81.5% · 1.1× |
| Mobile subscriptions | 136.0 per 100 (2024) | +1003% | #36 / 169 | median 116.4 per 100 · 1.2× |
| Fixed broadband | 23.3 per 100 (2024) | +10459% | #61 / 168 | median 12.1 per 100 · 1.9× |
| Electricity access | 99.8% (2024) | +1% | #88 / 169 | median 99.9% · 100% |
| Environment & security | ||||
| CO₂ emissions per capita | 1.6 t (2024) | +18% | #102 / 165 | median 2.6 t · 62% |
| CO₂ emissions (total) derived | 8.4 Mt (2024) | +48% | #113 / 165 | median 21.3 Mt · 39% |
| Renewable electricity share | 99.4% (2021) | +2% | #5 / 169 | median 34.1% · 2.9× |
| Renewable energy consumption | 34.2% (2021) | +5% | #67 / 169 | median 26.9% · 1.3× |
| Forest area | 60.4% (2023) | +8% | #21 / 169 | median 32.4% · 1.9× |
| Agricultural land | 33.1% (2023) | −7% | #104 / 169 | median 41.7% · 80% |
| Arable land | 3.3% (2023) | −16% | #130 / 168 | median 11.0% · 30% |
| PM2.5 exposure | 17.7 µg/m³ (2023) | −14% | #98 / 168 | median 19.8 µg/m³ · 89% |
| Military spending | N/A | N/A | N/A | |
Ranks are value-descending and count only the countries that have data for that metric (#1 = highest value); N/A rows occupy no rank.
The median is the unweighted middle value across the countries with data (gold tick) — not a world average. Bars grow with the value: reaching the tick means matching the median, and a full bar means twice the median or more. The median value and this country's multiple are noted under each bar.
Costa Rica's true-shape outline
Related tools and comparisons
Open Costa Rica in the interactive compare tool →
See Costa Rica's true size on the drag-and-drop map →
Measure the distance to Costa Rica →
Other countries
- United States
- China
- Germany
- Japan
- United Kingdom
- India
- France
- Russia
- Italy
- Canada
- Brazil
- Spain
- South Korea
- Mexico
- Australia
- Turkey
- Indonesia
- Netherlands
- Saudi Arabia
- Switzerland
- Poland
- Belgium
- Ireland
- Argentina
 United States
 China
 Germany
 Japan
 United Kingdom
 India
 France
 Russia
 Italy
 Canada
 Brazil
 Spain
 South Korea
 Mexico
 Australia
 Turkey
 Indonesia
 Netherlands
 Saudi Arabia
 Switzerland
 Poland
 Belgium
 Ireland
 Argentina
Show 75 more Show less
- Sweden
- Israel
- Austria
- Thailand
- United Arab Emirates
- Norway
- Vietnam
- Philippines
- Malaysia
- Denmark
- Colombia
- Bangladesh
- Romania
- South Africa
- Pakistan
- Czechia
- Egypt
- Iran
- Chile
- Portugal
- Peru
- Finland
- Kazakhstan
- Nigeria
- Algeria
- Greece
- New Zealand
- Iraq
- Hungary
- Qatar
- Ukraine
- Morocco
- Kuwait
- Slovakia
- Uzbekistan
- Kenya
- Bulgaria
- Ecuador
- Puerto Rico
- Dominican Rep.
- Ethiopia
- Guatemala
- Angola
- Ghana
- Oman
- Sri Lanka
- Cuba
- Croatia
- Luxembourg
- Serbia
- Côte d'Ivoire
- Venezuela
- Lithuania
- Belarus
- Dem. Rep. Congo
- Panama
- Tanzania
- Uruguay
- Myanmar
- Slovenia
- Azerbaijan
- Bolivia
- Uganda
- Jordan
- Sudan
- Cameroon
- Tunisia
- Cambodia
- Zimbabwe
- Turkmenistan
- Paraguay
- Latvia
- Libya
- Estonia
- Nepal
 Sweden
 Israel
 Austria
 Thailand
 United Arab Emirates
 Norway
 Vietnam
 Philippines
 Malaysia
 Denmark
 Colombia
 Bangladesh
 Romania
 South Africa
 Pakistan
 Czechia
 Egypt
 Iran
 Chile
 Portugal
 Peru
 Finland
 Kazakhstan
 Nigeria
 Algeria
 Greece
 New Zealand
 Iraq
 Hungary
 Qatar
 Ukraine
 Morocco
 Kuwait
 Slovakia
 Uzbekistan
 Kenya
 Bulgaria
 Ecuador
 Puerto Rico
 Dominican Rep.
 Ethiopia
 Guatemala
 Angola
 Ghana
 Oman
 Sri Lanka
 Cuba
 Croatia
 Luxembourg
 Serbia
 Côte d'Ivoire
 Venezuela
 Lithuania
 Belarus
 Dem. Rep. Congo
 Panama
 Tanzania
 Uruguay
 Myanmar
 Slovenia
 Azerbaijan
 Bolivia
 Uganda
 Jordan
 Sudan
 Cameroon
 Tunisia
 Cambodia
 Zimbabwe
 Turkmenistan
 Paraguay
 Latvia
 Libya
 Estonia
 Nepal
Data & method
Indicators: World Bank Open Data, 43 indicators — CC BY 4.0 © World Bank — https://creativecommons.org/licenses/by/4.0/; Surface area (sq. km) — CC BY 4.0 © World Bank — https://creativecommons.org/licenses/by/4.0/; Human Development Index — CC BY 3.0 IGO © United Nations Development Programme — https://hdr.undp.org/terms-use
Boundaries: Natural Earth 1:110m (public domain); surface areas are computed with an equal-area spherical formula (Chamberlin–Duquette).
Reference facts (capital, languages, currencies, subregion): mledoze/countries (ODbL).